
Metrics can be seen as the bridge between the vision of the institution and the execution of the strategic plan. A set of indicators that helps us determine if we are headed in the right direction, at the right pace, and with the right resources.

| Fall 2021 | Fall 2022 | Fall 2023 | 1-Year Trend | Target | |
|---|---|---|---|---|---|
| Overall | 28.9% |
29.7% |
24.5% | -15.2% | 30.0% |
| URM | 23.2% |
17.9% |
19.5% | -15.9% | -- |
First Generation |
23.8% |
18.6% |
17.6% | -26.1% | -- |


| AY 2019-20 |
AY 2020-21 |
AY 2021-22 | AY 2022-23 | AY 2023-24 | 3-Year Trend | Target | |
|---|---|---|---|---|---|---|---|
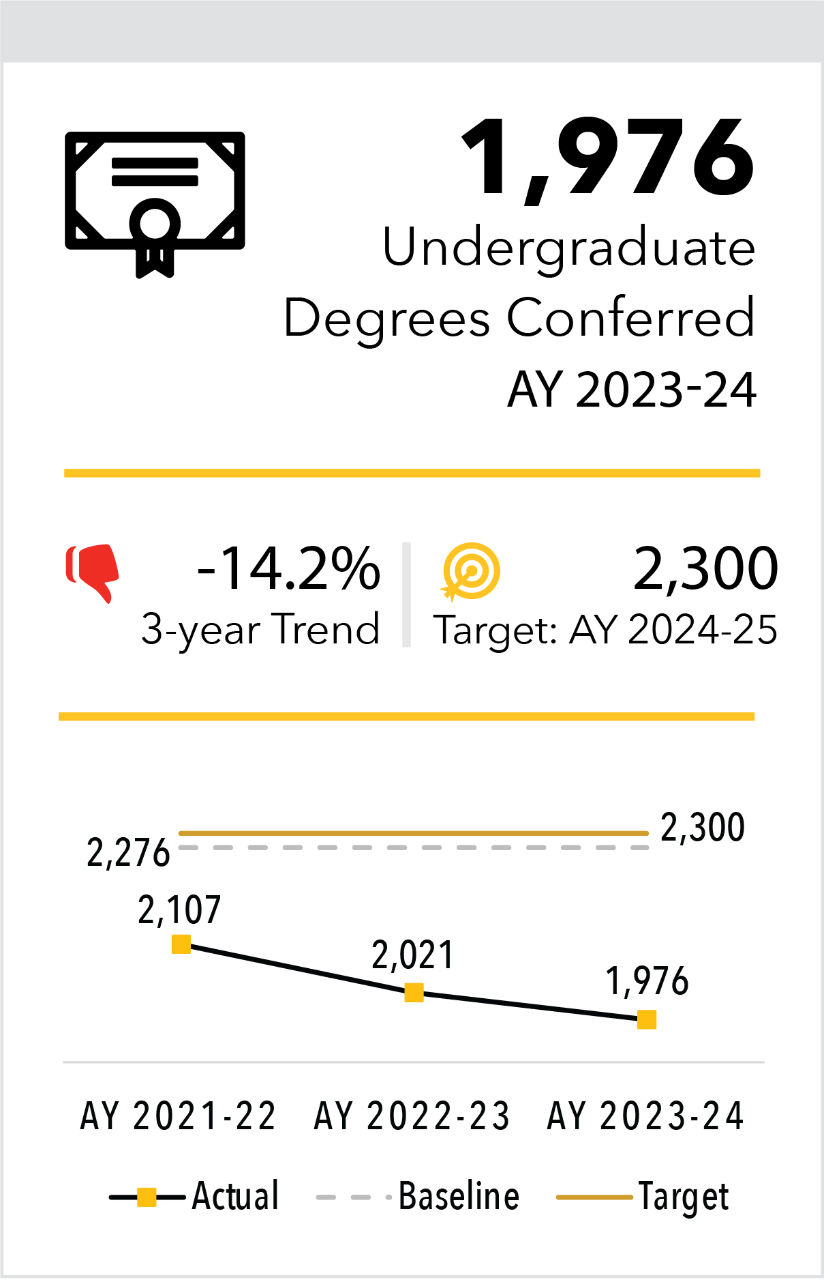
| Overall | 2,289 | 2,303 | 2,107 | 2,021 | 1,976 | -14.2% | 2,300 |
| URM | 256 | 311 | 283 | 246 | 251 | -19.3% | -- |
| First Generation | 905 | 989 | 936 | 844 | 780 | -21.1% | -- |
Low Income |
975 | 1,005 | 897 | 815 | 779 | -22.5% | -- |
| Fall 2019 to Fall 2020 |
Fall 2020 to Fall 2021 |
Fall 2021 to Fall 2022 |
Fall 2022 to Fall 2023 |
Fall 2023 to Fall 2024 |
3-Year Trend | Target | |
|---|---|---|---|---|---|---|---|
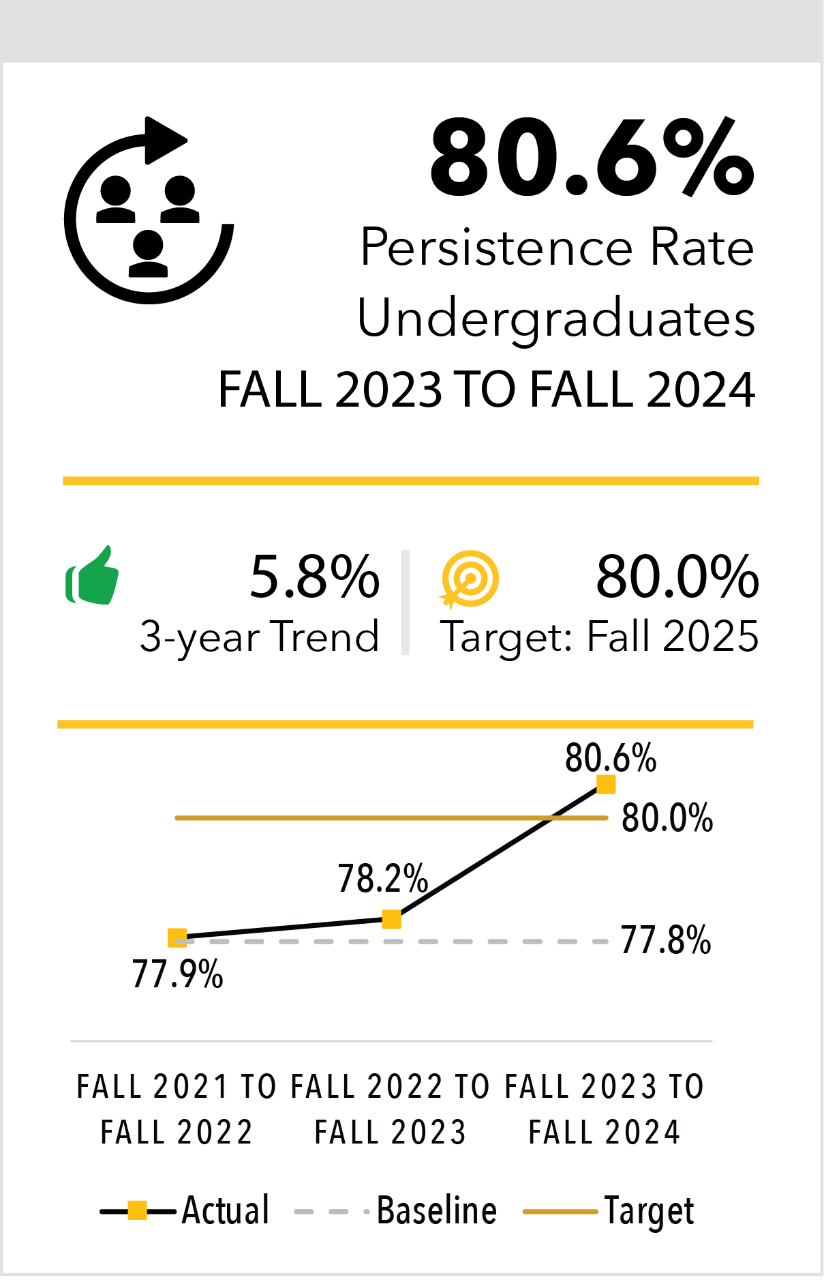
| Overall | 78.6% | 76.2% | 77.9% | 78.2% | 80.6% | 5.8% | 80.0% |
| URM | 74.7% | 70.3% | 72.9% | 73.4% | 73.6% | 4.7% | -- |
| First Generation | 75.9% | 71.9% | 72.8% | 73.7% | 75.3% | 4.7% | -- |
Low Income |
77.8% | 74.1% | 74.8% | 77.9% | 77.8% | 5.0% | -- |
| AY 2019-20 |
AY 2020-21 |
AY 2021-22 | AY 2022-23 | AY 2023-24 | 3-Year Trend | Target | |
|---|---|---|---|---|---|---|---|
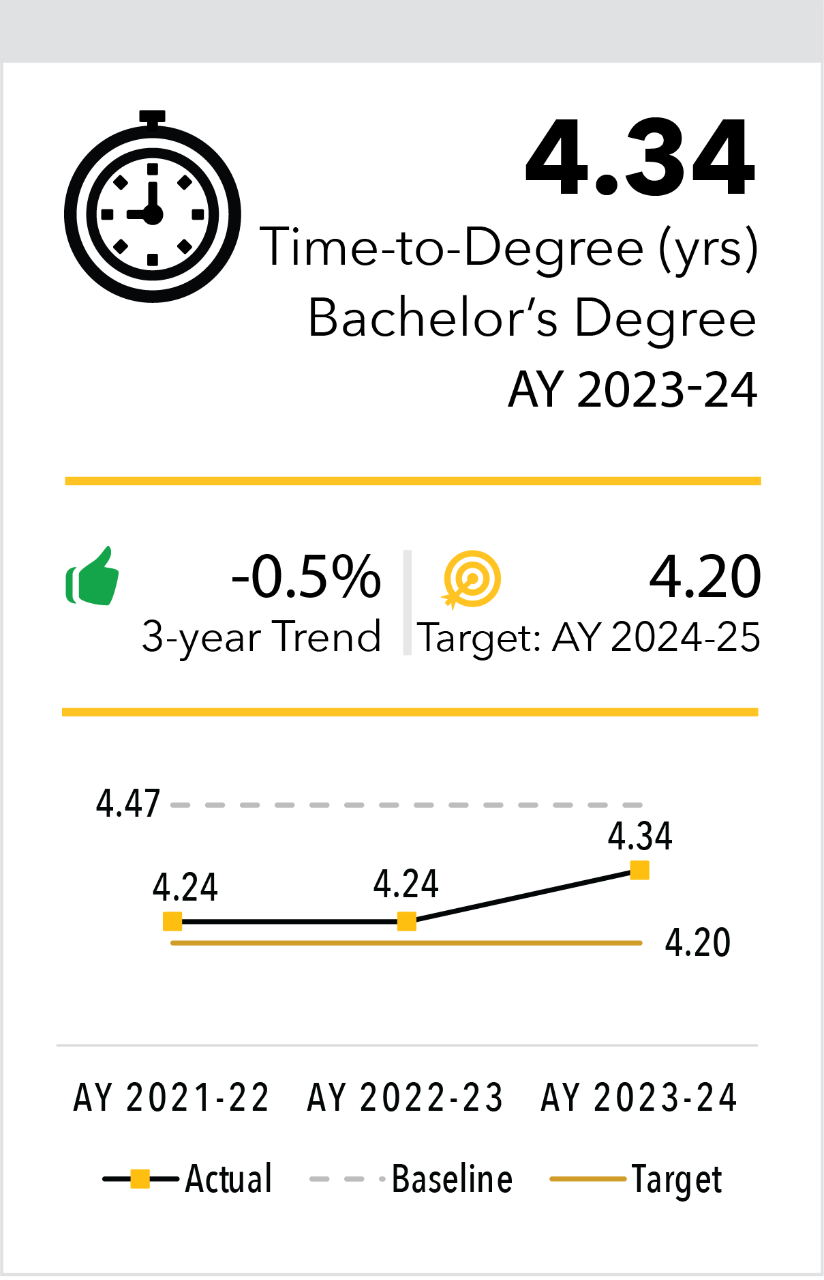
| Overall | 4.37 | 4.36 | 4.24 | 4.24 | 4.34 | -0.5% | 4.20 |
| URM | 4.43 | 4.47 | 4.36 | 4.28 | 4.53 | 1.3% | -- |
| First Generation | 4.44 | 4.40 | 4.30 | 4.33 | 4.36 | -0.9% | -- |
| Low Income | 4.57 | 4.55 | 4.36 | 4.39 | 4.42 | -2.9% | -- |
| AY 2019-20 |
AY 2020-21 |
AY 2021-22 | AY 2022-23 | AY 2023-24 | 3-Year Trend | Target | |
|---|---|---|---|---|---|---|---|
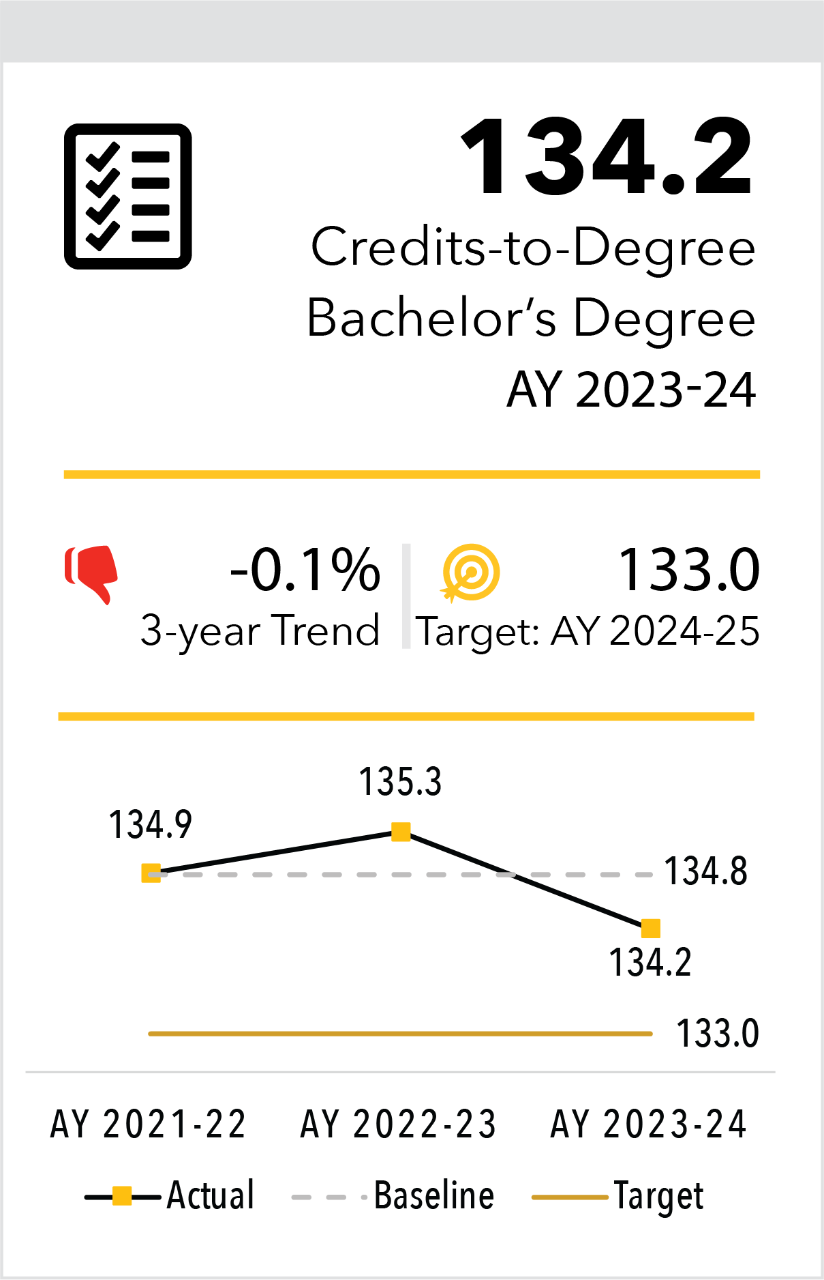
| Overall | 134.6 | 134.3 | 134.9 | 135.3 | 134.2 | -0.1% | 133.0 |
| URM | 132.8 | 134.1 | 131.5 | 132.0 | 133.4 | -0.5% | -- |
| First Generation | 134.0 | 133.7 | 134.3 | 135.2 | 134.4 | 0.5% | -- |
| Low Income | 134.5 | 134.1 | 134.4 | 135.0 | 134.8 | 0.5% | -- |